

A lot of our family tree is based on numbers, we are obsessed with them, birth dates, marriage dates, death dates and census returns. Thanks to the wonders of technology, we can now crunch these numbers from our family tree software programmes. Whatever software you use, there is usually a way of representing your family tree with some fancy charts. I have been using Family Tree Maker for the last 20 years and there are a huge variety of charts and reports that you can create.
These wonderful software programmes give us some statistical analysis of our tree data, but genealogy site MyHeritage can take this a whole lot further, with their wonderful set of statistical tools.
Crunching the numbers certainly won’t help me to break down any brick walls, but it provides me with some interesting facts and figures about my family tree. So here is my family tree in number form.
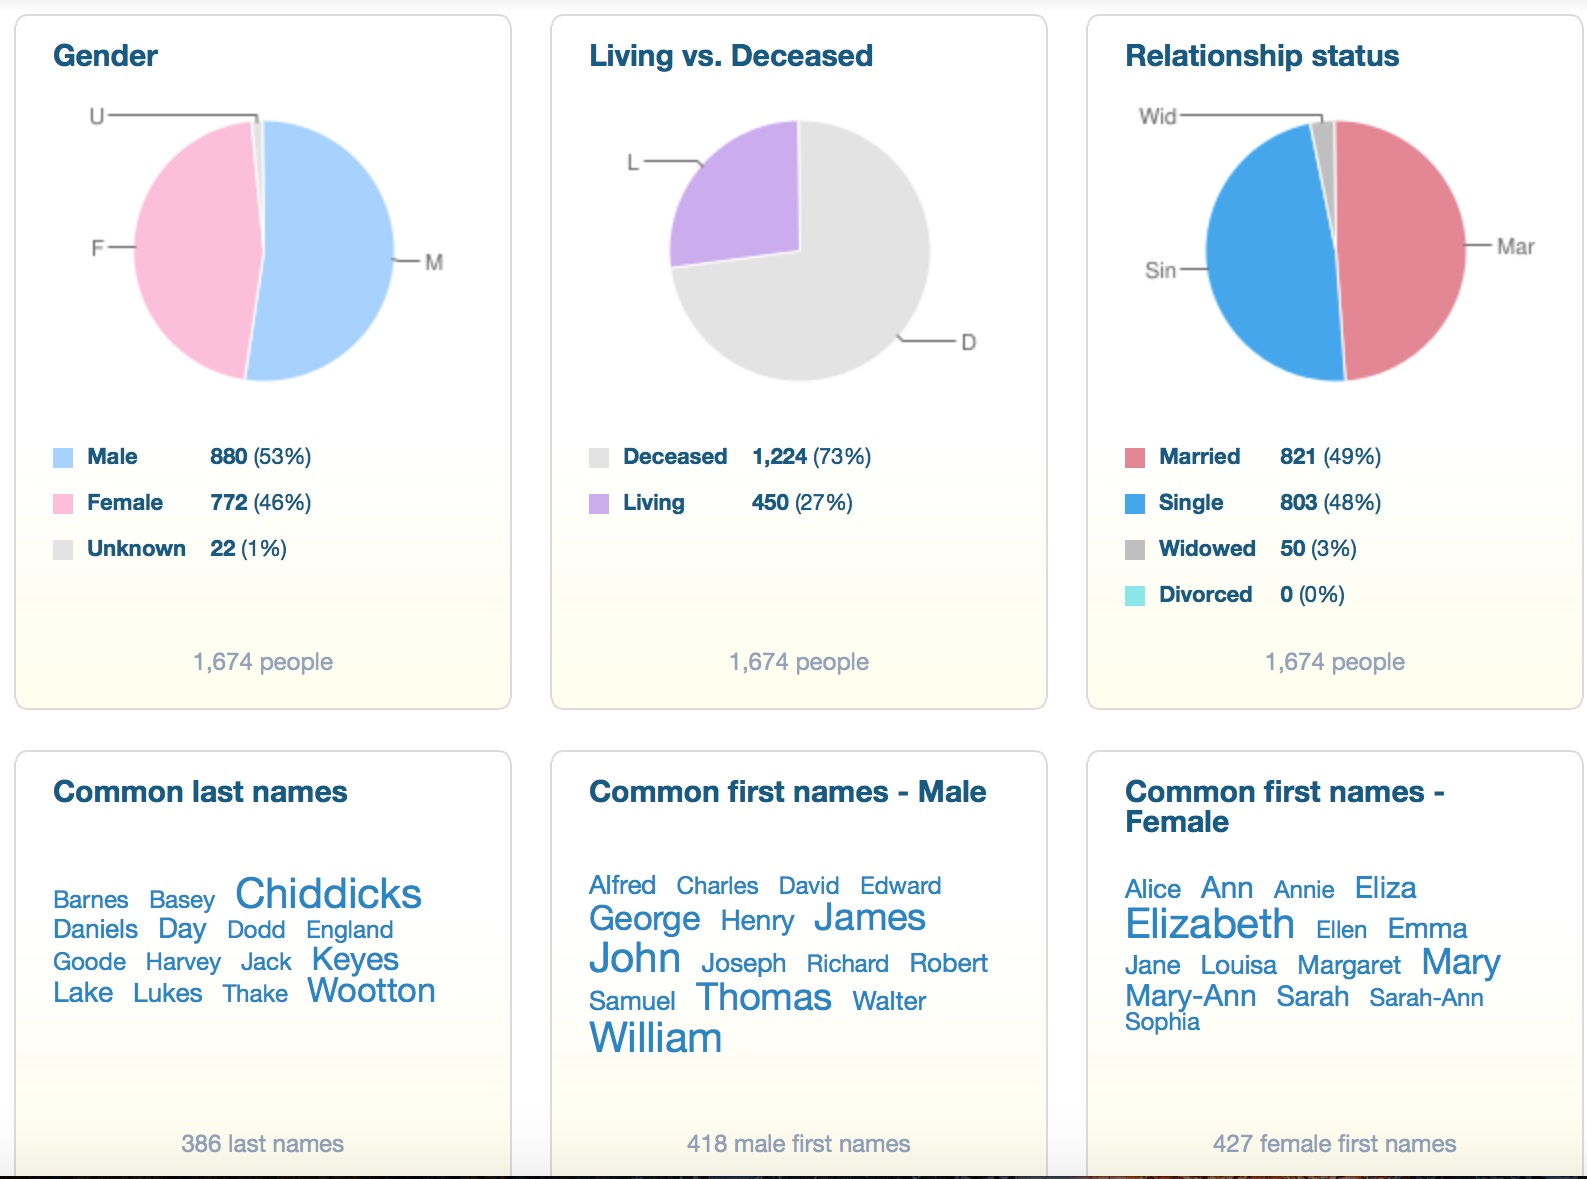
There are a total of 1675 people on my tree, 881 males and 772 females. Those of you with advanced maths will tell me that those two numbers do not equal 1675, I also have 22 people listed with an unknown gender, so this immediately highlights something that I need to address. There are also 460 marriages on my tree.
Of those 1675 people, 1224 are deceased, with 451 listed as living, which is misleading, because this really means I have 451 people listed without a death, which doesn’t mean necessarily, that they are still living.
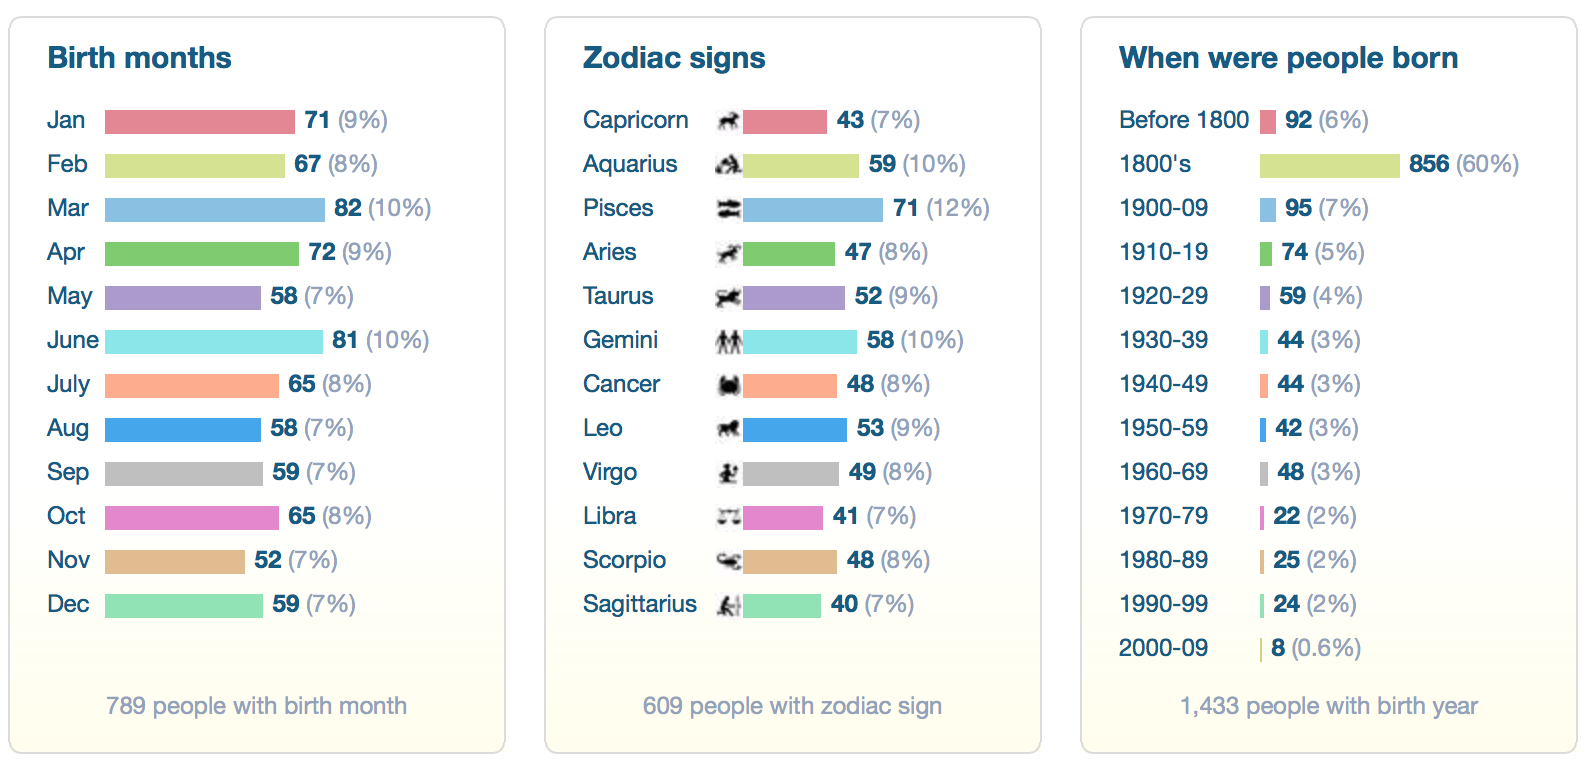
There are 386 different surnames on my tree of which Chiddicks, not surprisingly is the most common, with 156 people. There are also 95 Wootton’s, 78 Keyes and 54 Day’s. Moving onto first names, I have 418 different male first names, the most common is John with 62, followed by William 60 and Thomas 47. I found John really surprising, I know it’s a common name, but I would have said Thomas or William would have been a lot higher. It just shows how sometimes what we think we know, is different from what the facts tell us. There are 427 different female first names with Elizabeth 44 and Mary 31, the most common, notable mentions also to, Mary Ann 18, Ann 18, and Eliza 17.
Moving onto birthplaces, my tree percentage wise is made up of the following locations;
United Kingdom 95%
Ireland 3%
Canada 0.8%
USA 0.7%
New Zealand 0.3%
Italy, Singapore and Australia 0.1%
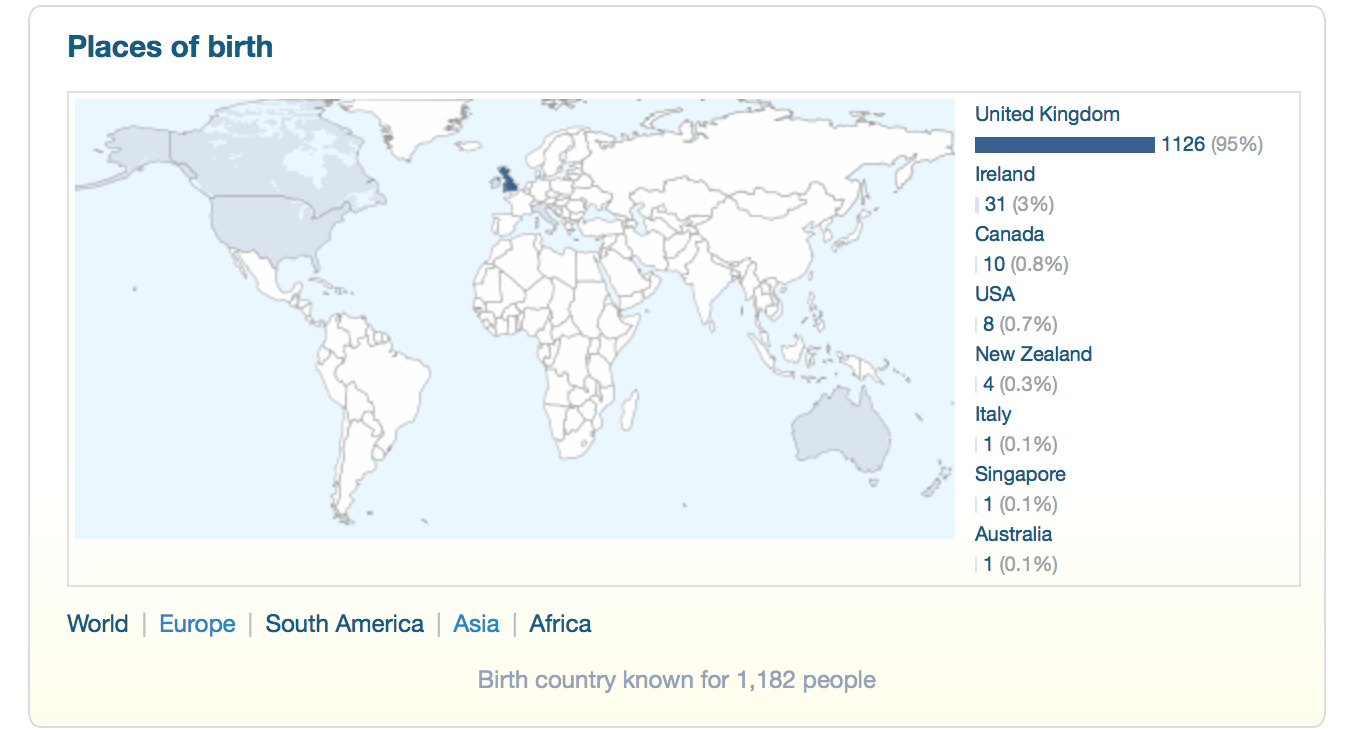
We never spread our wings very far did we? Globetrotters, we are most certainly not. Those facts are also consistent enough with my DNA ethnicity estimate for me to be confident that they are representative of my overall tree. The locations of death follows a similar pattern, with the addition of France and Belgium, sadly due to the losses during WW1.
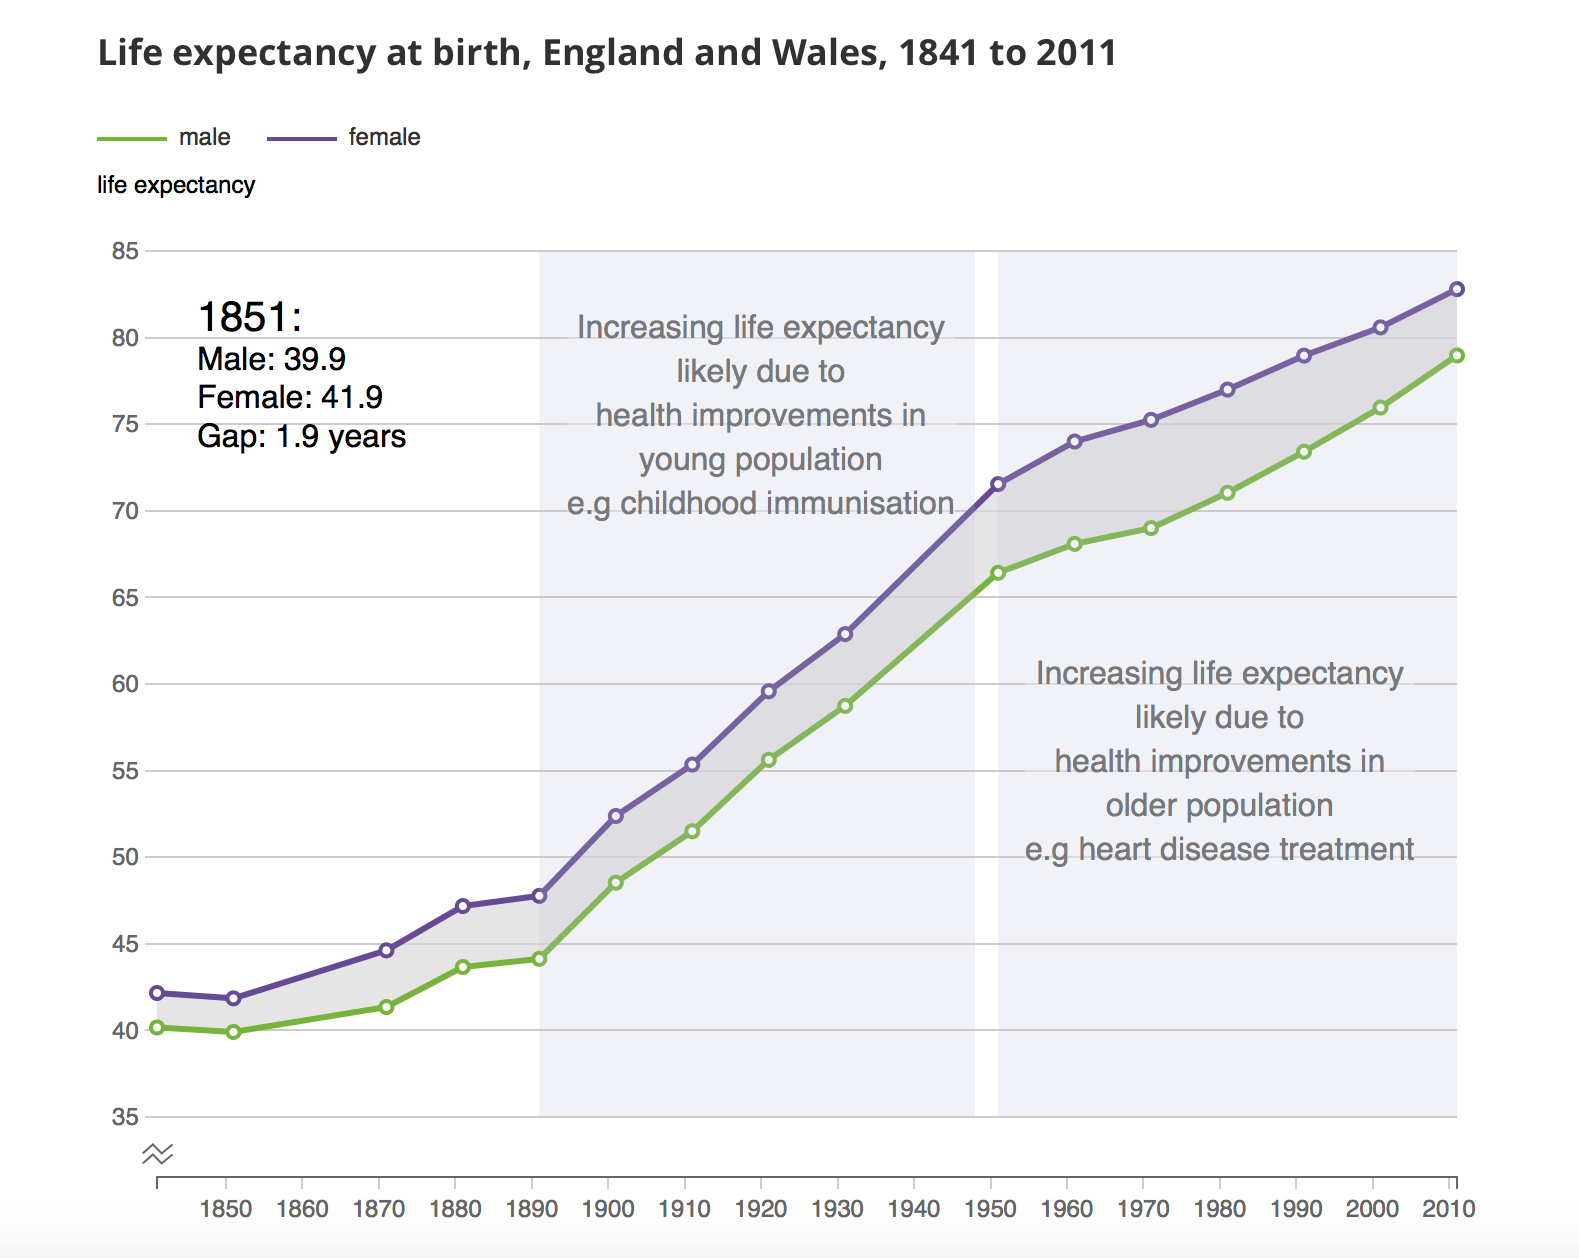
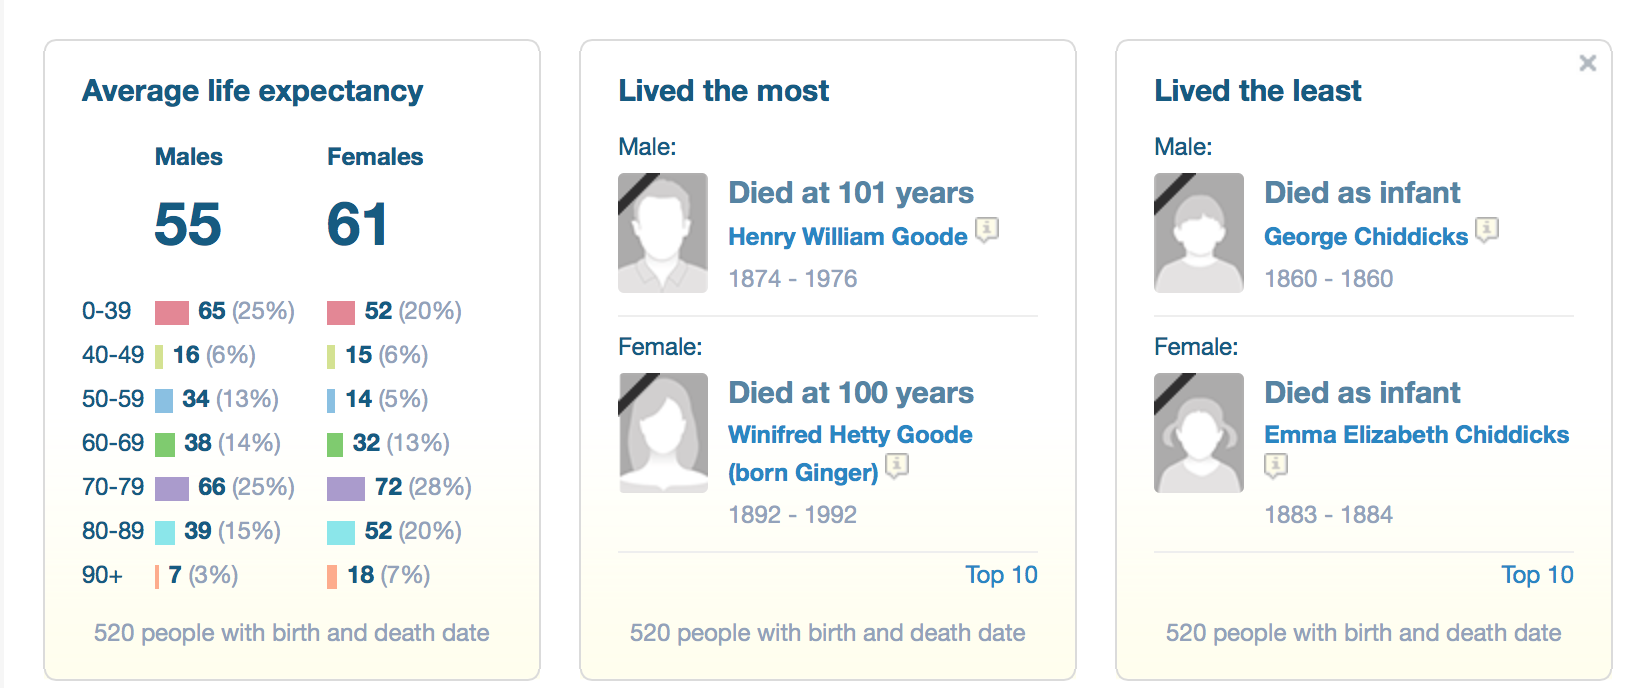
Age also brings some interesting statistics, the average life expectancy for a male person on my tree is 55 and female 61 Life expectancy in England and Wales in the mid-19th century was around 40 years for males and 42 years for females. These figures increased to around 45 and 50 years respectively by 1901 and life expectancy then rose dramatically until the mid- 1950s. The figures from my tree are consistent with the stats provided by the office for national statistics.
The oldest two ancestors on my tree lived until 101 and 100 and were from the same family, which you would think is not unusual, but what is unusual, is that they are not blood related. Henry William Goode lived from 1874 until 1976 and died aged 101 and his daughter-in-law, Winifred Hetty Goode (nee Ginger) lived until she was 100. Was it something in the water?
856 (60%) of the births on my tree were in the 1800s, with 6% (92) born before 1800, with the remainder born after the 1900s. That’s interesting and is a reflection of how much harder it is to get back into the 1700s. I am quite impressed to have 92 people born in the 1700s!
Moving onto marriages, there are numerous male and female ancestors, who married twice, but only one person, Arthur Gregson, who married 3 times. Sadly both Arthur’s two previous marriages ended with the loss of his wives, both dying far too young. The average age at marriage for males on my tree is 26.2 and for females 23.9, this falls almost identically in line with the national figures from 1900 which for men was 26 and women 22.
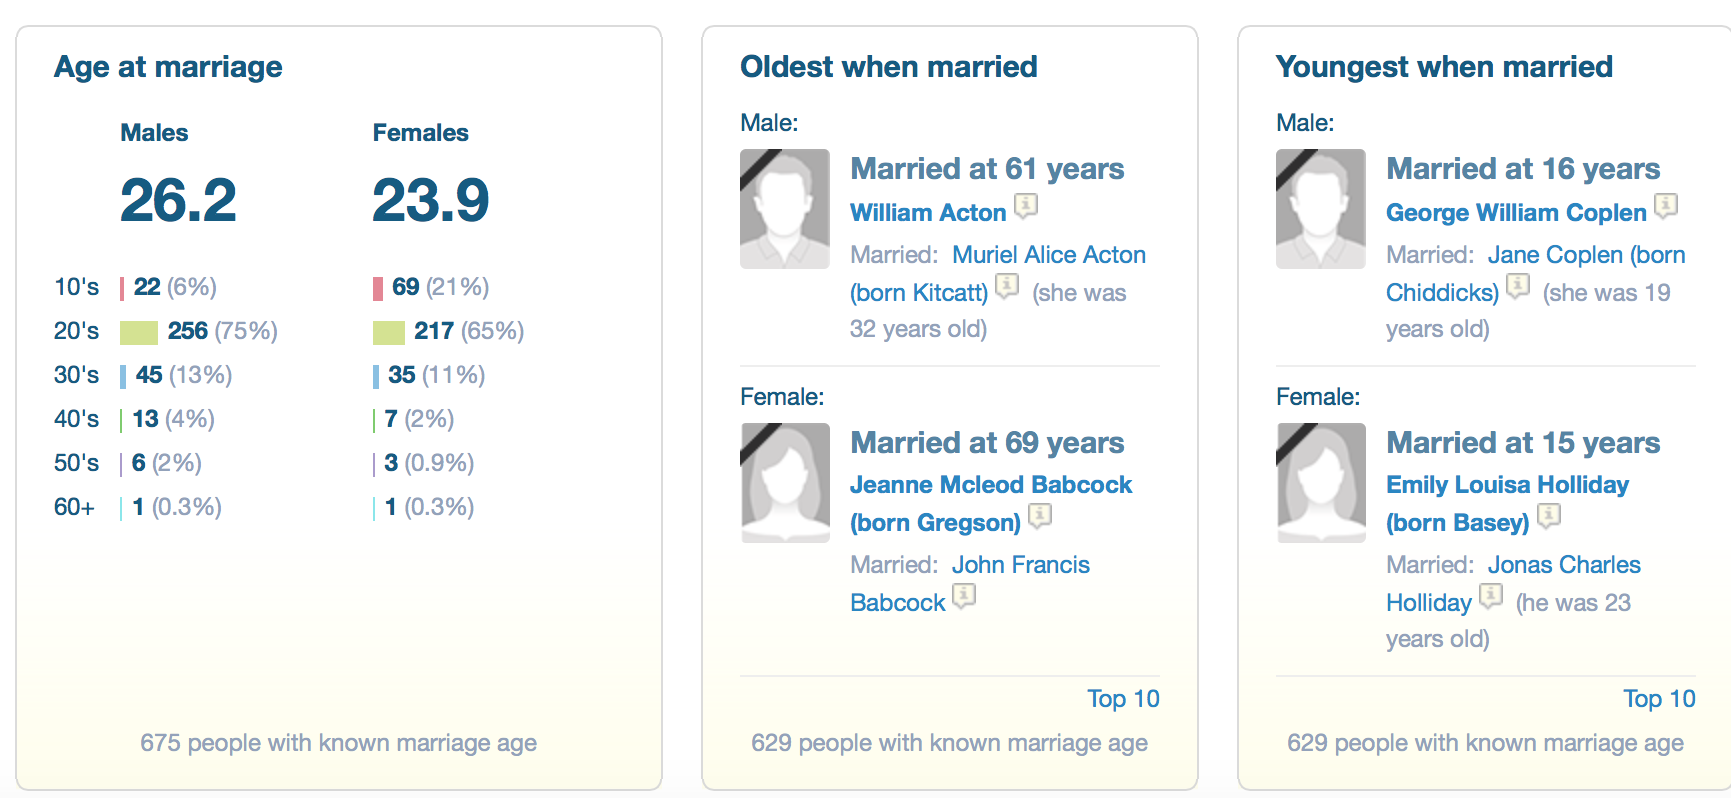
23 (7%) Males were married under 20 and a much larger number, 69 (21%) of females were married as teenagers. The majority of the marriages, as you would expect, took place with couples in their 20’s, 255 (74%) male and 217 (65%) female. Only one male and one female were married in their 60’s. William Acton married Muriel Alice Kitcatt (what a great name!) when he was 61 and Jeanie McCleod Whyte married John Francis Babcock when she was 69.
The youngest age at which anyone was married is the tender age of 16. George William Coplen married Jennet Chiddicks on 21st March 1887 in Romford in Essex. George was born on 7th April 1870, making him just shy of his 17th birthday, Jennet was three years older and 20 when they were married. The marriage certificate stated George was 21 and Jennet 20, clearly, George lied about his age. The youngest female ancestor to marry was also just 16 years old, Emily Louisa Basey who married Jonas Holiday who was 21 at the time. The image above is technically incorrect, she was 16 and not 15.
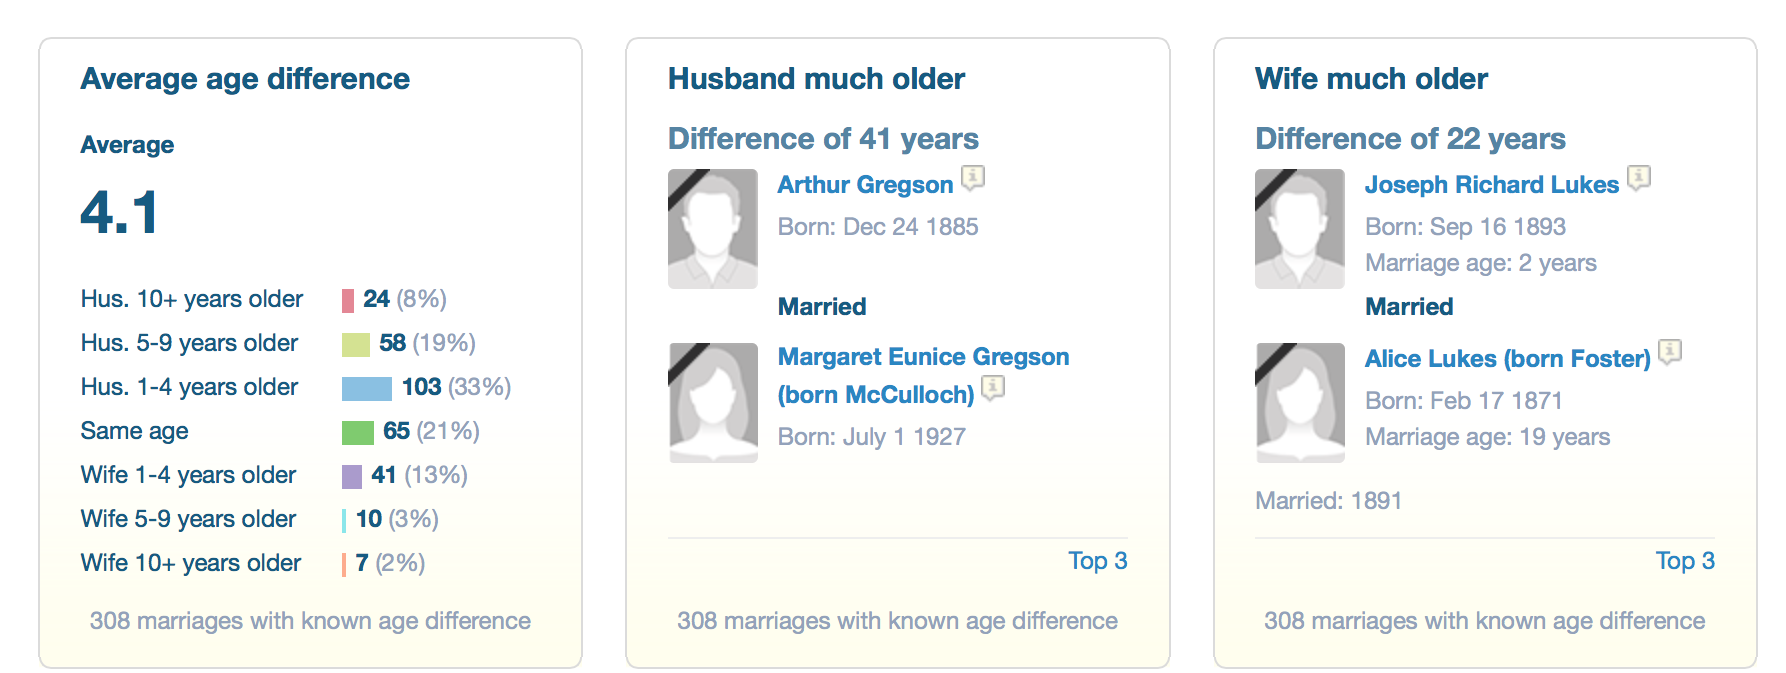
The longest marriage is impossible to calculate, but the shortest marriage certainly brings home the stark realities of war. Thomas Wootton married Mary Louisa Staples on 30th April 1917, sadly just five months later, on 26th September 1917, Thomas died at the Third Battle of Ypres – also known as Passchendaele. His young life tragically cut short by war and a young couple robbed of a future together. Continuing with the marriage facts, the biggest age difference between two people marrying on my tree was Arthur Gregson and Margaret Eunice McCulloch, a difference of 41 years. Arthur was born in 1885 and Margaret was born in 1927.
The next category that I want to analyse is children and their relationships within the family group. The most prolific couples on my tree belong to the Keyes family. James Layzell and Anna Maria Keyes had 13 children, between the years 1868 and 1893. Anna’s brother, George Keyes and his wife, Elizabeth Knott also had 13 children between the years 1863 and 1891. Large families must have run in the Keyes family because George Keyes and Anna Keyes parents, Joseph Keyes and Hannah Maria Keyes had 11 children!
The largest number of children on my tree, born to one family was 16, fathered by Samuel Chiddicks, but this was with two wives. 8 Children born to Harriett Burt between 1863 and 1876 and a further 8 children born to Elizabeth Johnson between 1880 and 1892.
The average age for having children was surprisingly high, 32 male and 29 female and I can’t see any logical explanation in the statistical analysis to explain this anomaly.
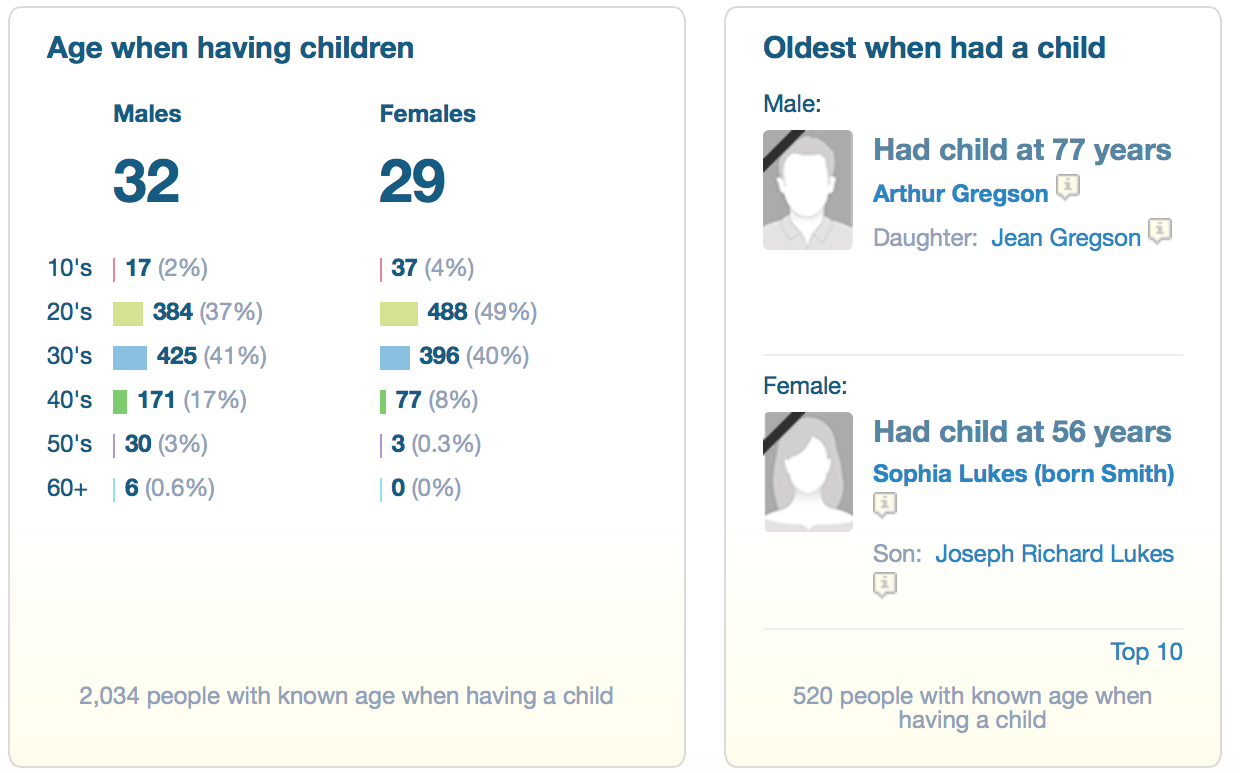
The oldest age for a father to father a child was an incredible 77! Arthur Gregson fathered Jean Gregson in 1963, he was born in 1885! In fact, Arthur holds the top 3 positions, he also fathered children when he was 72 and 68.
There is certainly a lot more statistically that I can record, but some of this data also highlights some inconsistencies within my own tree. I found this statistical analysis really interesting and a complete break from the normal way that we look at our tree and collect the data. This will never help me to knock down a brick wall, but it creates some interesting new information that I would never have discovered, had I not looked a bit further into my tree using the MyHeritage statistics page.
All My Blogs For Family Tree Magazine in one handy place
Copyright © 2021 Paul Chiddicks | All rights reserved

It’s always a bit interesting to analyze our trees to see how the numbers play out!
LikeLiked by 1 person
I found it fascinating Christine, I’m not normally a numbers geek, but the more I delved into it the more obsessed I became!
LikeLiked by 1 person
Thank you for this post! I see people asking about reports in the user group for my family tree software all the time and I pay no heed as I’d never looked into them (I’m happy to enter my data and documents) but now that you have given me a glimpse at the reports that are out there I may have to check this out.
Thank you for this most interesting post!
LikeLiked by 1 person
I am pleased that you found it helpful Becky
LikeLike
Very impressive statistical analysis!
LikeLiked by 1 person
Thank you Hettie
LikeLike
Very interesting!
LikeLiked by 1 person
Really fun to read this, Paul. You’ve got me inspired to do more of this!
LikeLiked by 1 person
Thank you, I’m so glad you enjoyed it
LikeLike
I enjoyed reading this. Sounds like MyHeritage has a lot to offer for this sort of analysis.
LikeLiked by 1 person
Thanks Eilene, each company has different things to offer and thus is the first time that I have had a subscription with them
LikeLiked by 1 person
Fascinating stuff. I found age at marriage quite surprising. I would have supposed it being some years younger in a database that is 60% 19th century. Do you think it is skewed by the number of 2nd marriages when people would have been obviously older. I married at 22 to 22 yo wife; father at 21 to 19 yo wife; gparents 20, 23, 29 & 28. That would average 24 male & 22.5 female – and that in 20th century. Food for thought.
LikeLiked by 1 person
Thanks Robert, the figures are definitely skewed because the tree has by definition an imbalance to it. Some of the figures for example, this stat: 1675 people, 1224 are deceased, with 451 listed as living, which is misleading, because this really means I have 451 people listed without a death, which doesn’t mean necessarily, that they are still living. So although a lot of facts, the small details also have to be considered as well
LikeLiked by 1 person
It is so interesting you know where your family is from. Thank you for sharing your research findings.
LikeLiked by 1 person
Thank you Lauren as you know I find it fascinating
LikeLiked by 1 person
Thanks for posting this. I have 4444 members in my tree and some unusual statistics, meaning the i have some errors to correct. I have not always been good at killing off my ancestors so this skews the stats. Work to do.
Gay J Oliver Web Administration Family History Society of Cheshire
On Mon, Apr 5, 2021 at 9:04 AM The Chiddicks Family Tree wrote:
> Chiddicks Family Tree posted: ” A lot of our family tree is based on > numbers, we are obsessed with them, birth dates, marriage dates, death > dates and census returns. Thanks to the wonders of technology, we can now > crunch these numbers from our family tree software programmes. Whatever ” >
LikeLiked by 2 people
I know what you mean about “killing them off” its one of my passions, in the nicest possible way of course! Is it yourself that runs the societies twitter page?
LikeLike
No it’s Margaret Roberts, but we work together and I often include your blog in my monthly newsletters. Margaret is our brilliant social media secretary.
LikeLiked by 1 person
I am so grateful to you both for your support for my blogs, it means a lot. I did send the twitter account (Margaret) a message, although I have no ancestors from Cheshire, having lived here for 20 years now, maybe I should join the society.
LikeLiked by 1 person
This is really interesting, Paul. A great way to notice trends, anomalies, and data gaps. Is this in the online MyHeritage? I had that until a year ago and don’t remember these tools. I currently only have the online Ancestry subscription. Does FamilyTree Maker have out of the box reports like this too?
LikeLiked by 2 people
Thank you I’m glad you enjoyed it. The bulk of the data is from my heritage and I have a subscription with them, but family tree maker does have a lot of different ways to chart and report your tree data, I probably under utilise what they have.
LikeLiked by 3 people
Great article. It’s important to review what we have in our trees.
LikeLiked by 1 person
Thank you much appreciated
LikeLiked by 1 person
Fascinating and inspirational analysis – must give it a go when I have finished my A to Z.
Regards
Anne
LikeLiked by 1 person
I am so pleased you enjoyed it Anne, I am not normally a numbers person myself, but once I started I found it very addictive!
LikeLiked by 1 person
I am really surprised by your story and the analysis that MyHeritage offers… I took the 24Genetics Ancestry Test a few months ago and I was very happy with how complete it was in terms of the accuracy and comprehensiveness they give you about your ancestry… but after reading your story I am considering taking the MyHeritage Test!
Thank you so much for sharing
LikeLiked by 1 person
Hi Alfred the data that I have used comes from taking out a MyHeritage subscription, it doesn’t come from a DNA test. I have taken a DNA test with Ancestry and uploaded my results to MyHeritage but the numbers in the blog come from the Subscription rather than the DNA, I hope that helps.
LikeLiked by 1 person
The 56-year-old woman having a child, may have passed a child of an unmarried daughter as her own.
LikeLiked by 1 person
Thanks and that’s extremely likely which always makes exercises with stats that bit more difficult
LikeLike
Somehow it’s a tradition to do a family tree statistics blog post on Valentine’s day, February 14:
See, for example: https://ancestralworld.blogspot.com/2020/02/ancestor-score-2020-797-in-10th.html and https://en.geneanet.org/genealogyblog/post/2014/04/what-s-your-ancestor-score-html
LikeLiked by 1 person
I had no idea, thanks for sharing Joan
LikeLiked by 1 person
Paul, this is very well-written and absolutely fascinating. Both the statistics themselves and the fact that there are tools to calculate these statistics. I had no idea these tools existed and can see it gives a whole new perspective on our family histories. I’m already on MyHeritage, but have never used Family Tree Maker. I’m looking forward to using some of these new found tools on my own family tree.
LikeLiked by 1 person
Thank you Cristina I’m glad you enjoyed the post. I’m not normally a numbers geek myself but the more I used this the more I enjoyed it.
LikeLiked by 1 person